

If you have taken the Creative Behaviours Questionnaire on Talent Alpha Platform, you have measured several psychological traits that determine your creative style and approach to problem-solving. Learn more about the meaning of your results and the questionnaire itself.
What is the Creative Behaviours Questionnaire?
Developed by a group of scientists in 1989 and revised in 20161, the Creative Behaviours Questionnaire (CBQ) is a psychometric tool that allows you to measure your creative style on two subscales – Algorithmic-Heuristic Thinking and Conformity-Nonconformity. Additionally, we can calculate the score for the whole questionnaire, giving the results on the conventionality – creativity scale.
Is the CBQ just a quiz?
No, the CBQ is a psychometric test with tested and proven reliability and validity. Talent Alpha scientific team has adapted the revised version of the tool and tested its properties on the sample of nearly 300 IT specialists. CBQ results are standardized and individual results can be compared to the reference group – thanks to that you can quite precisely know, what percent of the people in IT have stronger or weaker creativity than you.
What does the CBQ measure?
- Algorithmic & Heuristic Thinking
According to the theory behind the CBQ, your thinking style can be placed somewhere on the spectrum between extremely algorithmic and extremely heuristic thinking.
Algorithmic thinkers distinguish themselves in the precision of reasoning and in paying attention to details. Good at discovering patterns and dependencies, they effectively solve problems that tend to reoccur. They prefer predictable, well-defined tasks that are broken down into steps for them.
Heuristic thinkers find novel solutions to typical problems and quick reactions to new, poorly defined problems. They think outside the box, creatively linking issues seemingly not connected with each other. You can trust they will find shortcuts and simplifications.
- Conformism & Nonconformism
Another dimension of creativity can be expressed in social situations. People with different levels of nonconformity will have different approaches to expressing their ideas in a group and coming up with solutions when callaborating with others or alone.
Conformists prefer the stability of rules, procedures, and environments over constant adaptation. They stick to proven ways and let others manage the situation. They don’t feel the need to stand out and do things differently, which makes them trustworthy and predictable.
Nonconformists prefer independence and flexibility, always demand innovation and question the status quo. They express ideas with confidence and respect people who do the same. They take up a lot of space in discussions, but having them involved brings a lot of energy to the team.
- Conventionality & Creativity
Lastly, people generally prefer either more conventional or ground-breaking jobs and solutions. Everyone lies somewhere on this spectrum. Those who are more conventional can support a project by being down-to the earth and stopping the effort if the team tries to reinvent the wheel. Those who are more creative will give opposing energy and will more likely push for more innovation.
How should I interpret my results?
Your results are presented on a scale from 1 to 10. This is a standard scale that reflects the normal distribution of the psychological trait in the population. In other words, your score can tell how you compare to others.
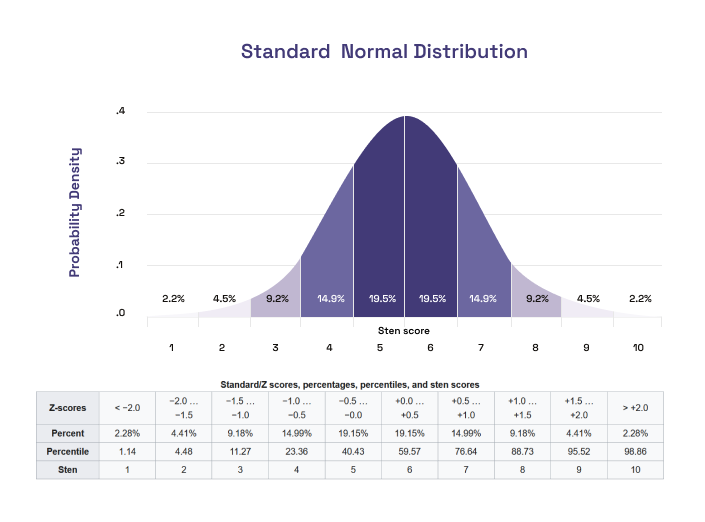
If you have a score of 5, it means that 50% of people scored lower, and 50% higher than you. If you have the score of 10 – it means that your trait is stronger than 97,72% other IT Specialists on our platform. Because of this correlation, your score can change over time – as more Specialists take the test, we will change the reference group from the general population to the population of IT Specialists on our Platform.
Besides a single score, you can also see a colored belt to the left and right of your score – this is our way of showing our confidence in your result. It is an honest approach that takes into account the limitations of the measurement. Because of natural fluctuations of your mood or focus and inevitable measurement error your true trait level lies somewhere in this colored spectrum (with 85% confidence interval). We take into account that the result could be slightly different if you took the measurement on the other day and try to reflect it in a way we communicate the results.
Which results are good and which are bad?
There are no good or bad levels of a given trait. Their variance is an effect of the neurodiversity of human beings. They give us an advantage in certain situations, so the right match between your personality and the context is key to your satisfaction and productivity.
Some of the results may not seem positive to you in an obvious way. Those whose score on the creativity scale is lower than in 98% of the population belong to the 2% of the most consistent, disciplined and meticulous. They can produce extraordinary work in an environment that demands close following of the conventions and patterns. Those whose score on this scale is higher than 98% of the population, belong to the 2% of the most inventive, flexible and bold. These minds will thrive in a project that doesn’t put many restrictions on them and will prefer working with an indecisive client that is open to suggestions. Bear in mind, most people land somewhere in between these extremes. Think about your traits as your strengths – as patterns of behavior that you exercised and strengthened because they have allowed you to adapt to your surroundings as best as you can so far.
References:
1 Bernacka, R. E., Popek, S. L., & Gierczyk, M. (2017). Kwestionariusz Twórczego Zachowania KANH III–prezentacja właściwości psychometrycznych. Annales Universitatis Mariae Curie-Skłodowska, sectio J–Paedagogia-Psychologia, 29(3), 33.
Read also
Why Companies Use Talent Alpha?
Talent Alpha is the most recognized platform of its kind in Poland, operating across 61 countries worldwide.
What is Talent Alpha?
Talent Alpha is a FREE IT talent marketplace platform that connects IT service providers with companies looking for skilled IT specialists
The Human Cloud Ecosystem - Re-Shaping the Business World
Although cloud service was already on the rise before the pandemic, it wasn’t a necessity for many of the people in the industry. What has changed since then?